Performance Metrics
| Entry CPU | 8.23 | Price P/L $ | $0.00 |
| Exit CPU | 7.24 | Div P/L $ | $0.00 |
| Fees | $0.00 | Gross P/L $ | $-25.72 |
| Reg Fees | $0.00 | Net P/L $ | $-25.72 |
| Commissions | $0.00 | P&L% | -12.02% |
| Cash Div. | $0.00 | Total Ret. % | 0.00% |
| Max Qty | 26 | Open P/L $ | $0.00 |
| Current Qty | 0 | Open P&L% | 0.00% |
| Max Cost | $213.96 | Open Value | $0.00 |
Trade media
No media uploaded for this trade yet.
| Price | $7.57 | Prev Close | $7.69 | Mkt Cap | $1.16B |
| Enterprise Val | $2.23B | P/E (TTM) | — | Forward P/E | 8.36 |
| EPS (TTM) | -0.84 | Forward EPS | 0.90 | Book/sh | -1.39 |
| ROE | -0.23% | Debt/Eq | 284.90 | Current Ratio | 2.25 |
| Short Interest | 29.79M | Short Float | 0.25% | Short Ratio | 5.59 |
| Avg Vol | 5.50M | Div Yield | — | Next Earnings | 2026-08-06 |
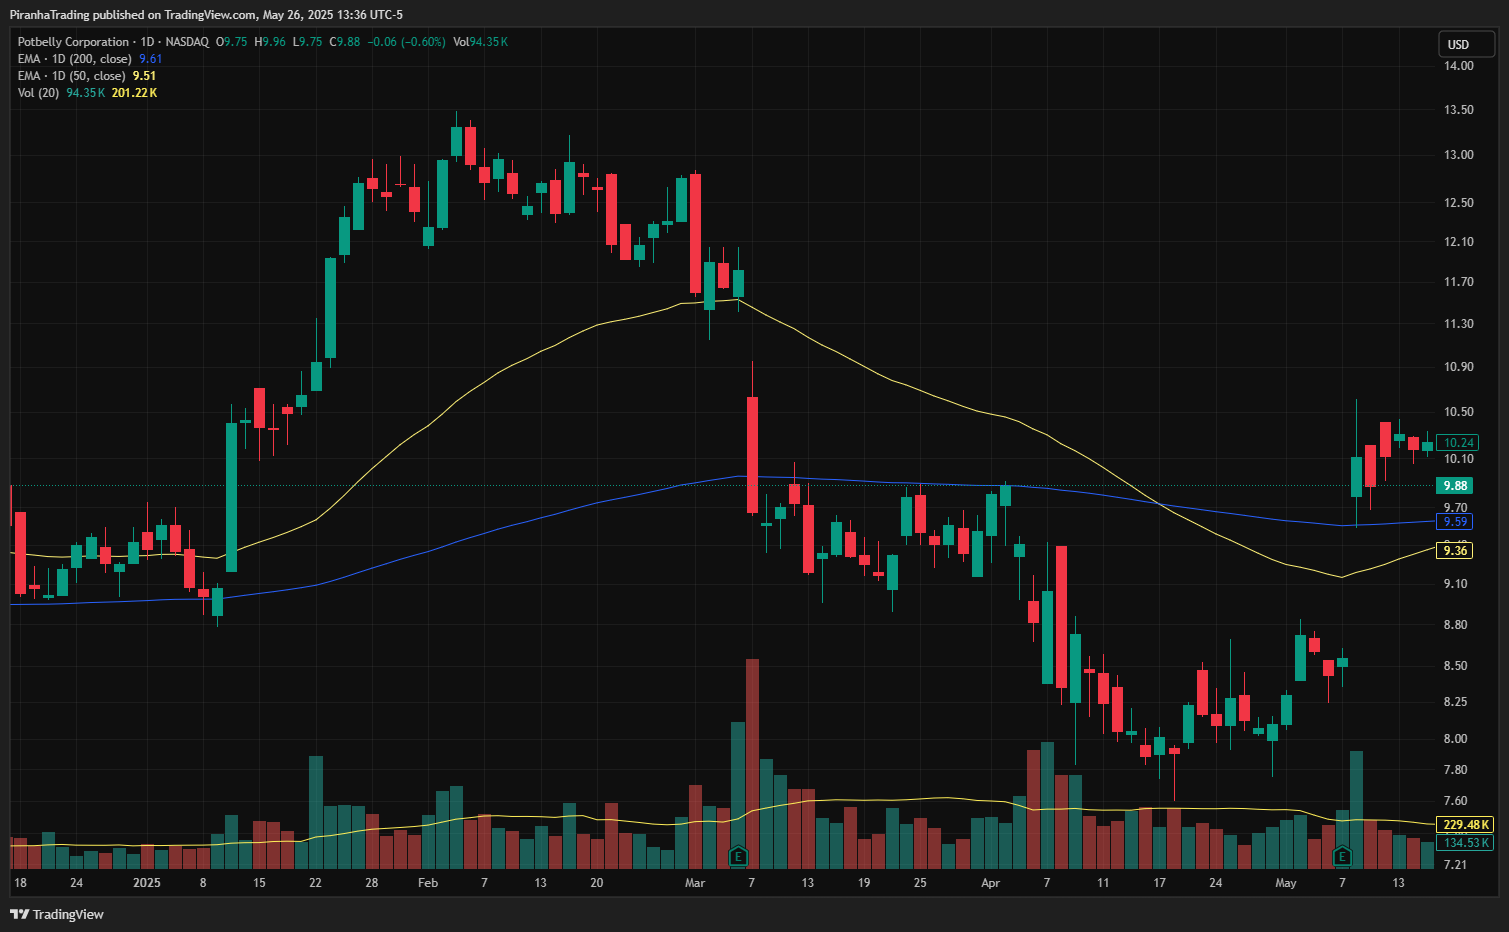
Auto-generated Chart
Notes
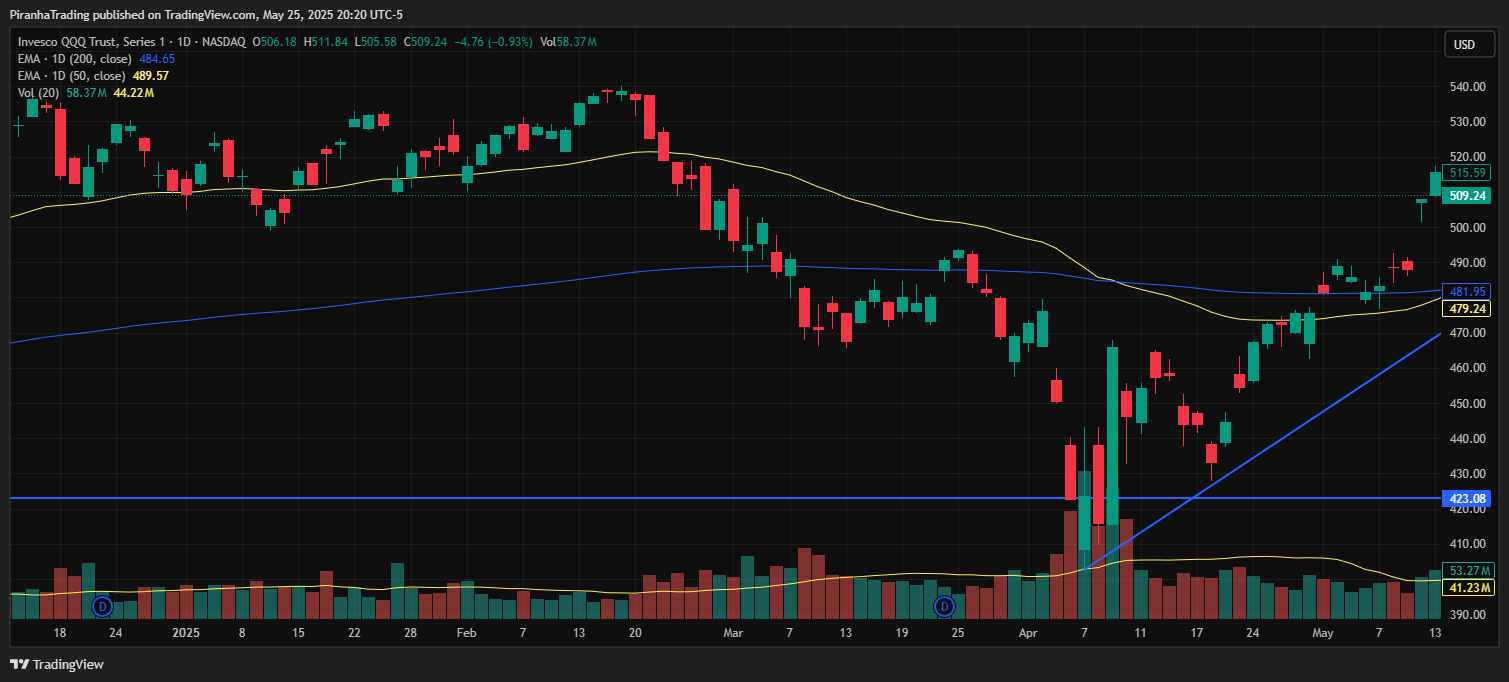
Big Picture:
What was going on in the market overall? What broader conditions or catalysts mattered? The market as a whole had been rallying and bullish sentiment all around. SPY just broke out to the upside through a H&S pattern.
Intraday Fundamentals / Catalyst:
What was the specific reason this stock was in play? Earnings, news, sector strength/weakness, volume, etc.The Stock recently reported good earnings and was gaining momentum afterwards, gaining volume and shooting higher
Technical Setup:
Describe the chart pattern. What were the key levels? Timeframe? Indicators?
What made the trade compelling visually?The trade made a new relative hugh and blasted through the 200 EMA, in fact all emas were now below it. I did ignore the long wick on the candle the day before my entry which showed selling pressure
Entry / Exit:
Where and why did you enter? I entered the next morning hoping I could ride the momentum but considering I just said hope, it was a bad strategy
How did you size?Im trading a small account right now so position size isnt a factor. It was like $300
Where did you scale or exit — and why?No scaling, I exited when I saw a bearish engulfing candle
Trade Management:
What was the plan?I didnt have one
Did you follow your plan?Didnt have one
Did you adapt to the market correctly as the trade developed? Yes I realized it was a stupid trade I had no business making
What I Did Well:
What did you execute like a pro here? The only smart thing I did was exit on the engulfing candle
What I Could Do Better:
Where did you slip? Hesitation, size, poor risk adjustment, emotional interference? I was chasing. Feeling like I had to be in the market which is a losing strategy. No real pattern, waiting for a pullback could of been justifiable
Playbook Worthy? (Yes/No): Terrible Trade, Never take again
Would you take this trade again? Is it a core setup or situational?
Grade: F
Transactions
3 entries| Date | Side | Amount | Price | Commission | Exchange / SEC | Current amt | Current value |
|---|---|---|---|---|---|---|---|
| May 19, 2025 12:00:00 | Exit | ||||||
| May 14, 2025 12:00:00 | Entry | ||||||
| May 14, 2025 00:34:33 | Entry |