Apr 1, 2020
Apr 1, 2020
P&L%:
-8.93%
Net P/L $:
$-106.40
Performance Metrics
| Entry CPU | 6.27 | Price P/L $ | $0.00 |
| Exit CPU | 5.71 | Div P/L $ | $0.00 |
| Fees | $0.00 | Gross P/L $ | $-106.40 |
| Reg Fees | $0.00 | Net P/L $ | $-106.40 |
| Commissions | $0.00 | P&L% | -8.93% |
| Cash Div. | $0.00 | Total Ret. % | 0.00% |
| Max Qty | 190 | Open P/L $ | $0.00 |
| Current Qty | 0 | Open P&L% | 0.00% |
| Max Cost | $1,191.30 | Open Value | $0.00 |
Featured Image / Proof

| Price | $1.60 | Prev Close | $1.68 | Mkt Cap | $235.67M |
| Enterprise Val | $76.69M | P/E (TTM) | — | Forward P/E | -3.70 |
| EPS (TTM) | -0.73 | Forward EPS | -0.43 | Book/sh | 0.59 |
| ROE | -0.80% | Debt/Eq | 2.23 | Current Ratio | 4.16 |
| Short Interest | 6.85M | Short Float | 0.05% | Short Ratio | 2.27 |
| Avg Vol | 1.76M | Div Yield | — | Next Earnings | 2026-08-06 |
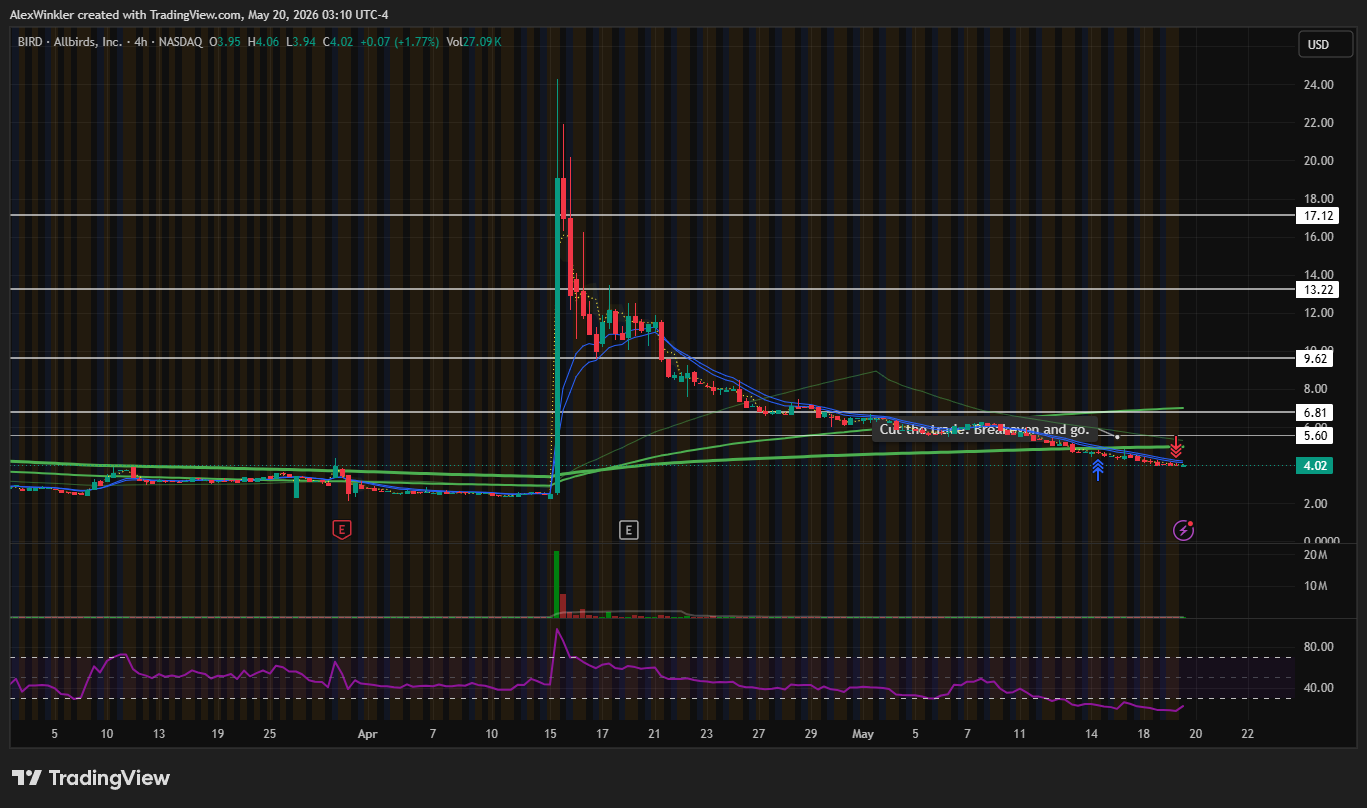
Auto-generated Chart
Notes
Everything about this trading during the review was so obvious. I really just dropped the ball. I even felt me messing up while I was in the trade when I was thinking about avg down. The video goes into much more detail like always https://youtu.be/-lLsnfJsRsQ
Transactions
3 entries| Date | Side | Amount | Price | Commission | Exchange / SEC | Current amt | Current value |
|---|---|---|---|---|---|---|---|
| Apr 01, 2020 09:58:15 | Exit | ||||||
| Apr 01, 2020 09:45:54 | Entry | ||||||
| Apr 01, 2020 09:34:53 | Entry |