May 11, 2020
P&L%:
3.27%
Net P/L $:
$26.30
Performance Metrics
| Entry CPU | 4.73 | Price P/L $ | $0.00 |
| Exit CPU | 4.88 | Div P/L $ | $0.00 |
| Fees | $0.00 | Gross P/L $ | $26.30 |
| Reg Fees | $0.00 | Net P/L $ | $26.30 |
| Commissions | $0.00 | P&L% | 3.27% |
| Cash Div. | $0.00 | Total Ret. % | 0.00% |
| Max Qty | 170 | Open P/L $ | $0.00 |
| Current Qty | 0 | Open P&L% | 0.00% |
| Max Cost | $804.10 | Open Value | $0.00 |
Featured Image / Proof

Notes
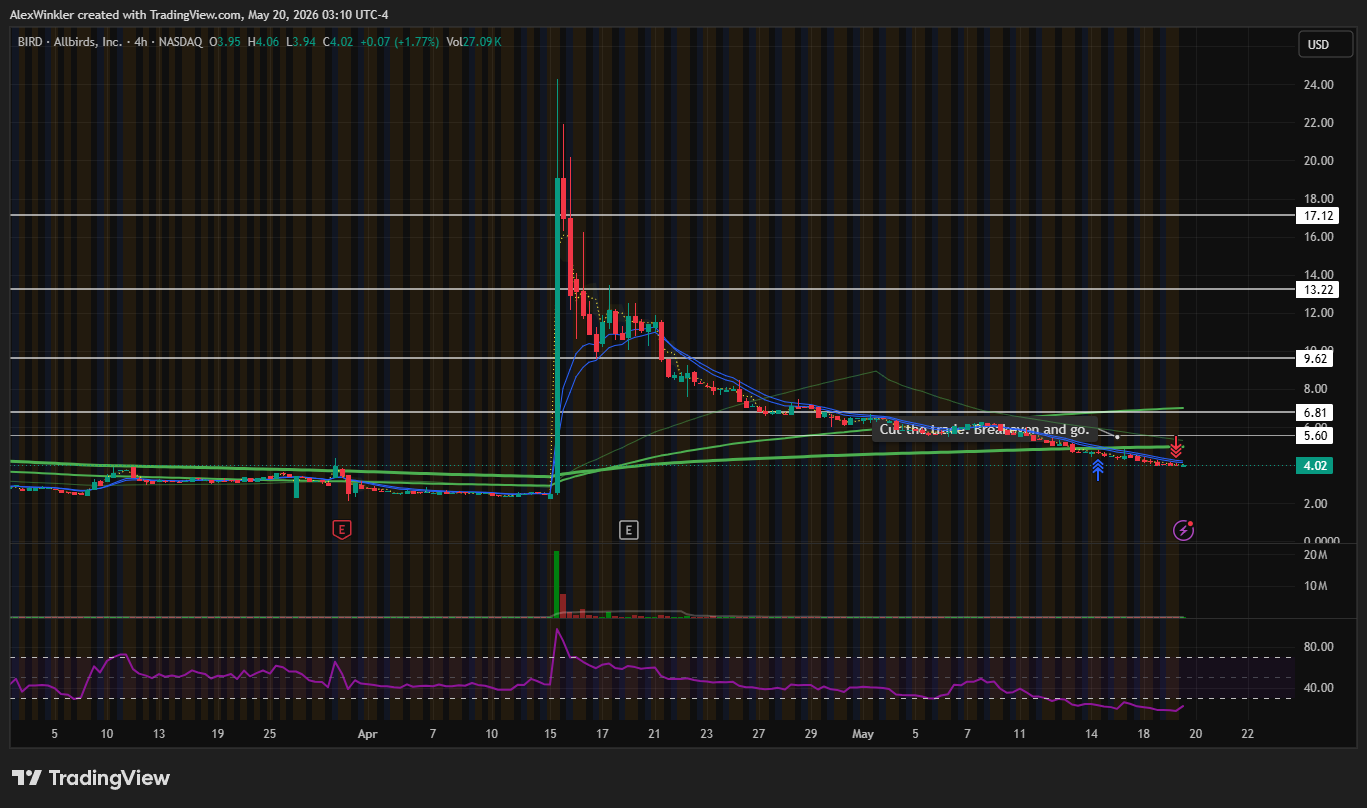
Bought near the low on the second green candle, were down about 10%, knew it was a bit thickly traded PM and probably a lot of bag holders. Red to gren setup felt obvious and 4.6 was big time multi month support and resistance. Lead gapper so didn't think we'd reach it. https://youtu.be/5cP0aJZq194
Transactions
3 entries| Date | Side | Amount | Price | Commission | Exchange / SEC | Current amt | Current value |
|---|---|---|---|---|---|---|---|
| May 11, 2020 09:35:35 | Exit | ||||||
| May 11, 2020 09:34:39 | Exit | ||||||
| May 11, 2020 09:31:59 | Entry |