Jun 1, 2020
Jun 1, 2020
P&L%:
4.02%
Net P/L $:
$40.00
Performance Metrics
| Entry CPU | 2.49 | Price P/L $ | $0.00 |
| Exit CPU | 2.59 | Div P/L $ | $0.00 |
| Fees | $0.00 | Gross P/L $ | $40.00 |
| Reg Fees | $0.00 | Net P/L $ | $40.00 |
| Commissions | $0.00 | P&L% | 4.02% |
| Cash Div. | $0.00 | Total Ret. % | 0.00% |
| Max Qty | 400 | Open P/L $ | $0.00 |
| Current Qty | 0 | Open P&L% | 0.00% |
| Max Cost | $996.00 | Open Value | $0.00 |
Featured Image / Proof

| Price | $3.82 | Prev Close | $4.12 | Mkt Cap | $4.25M |
| Enterprise Val | $15.29M | P/E (TTM) | 0.01 | Forward P/E | 6.95 |
| EPS (TTM) | 578.10 | Forward EPS | 0.55 | Book/sh | 34.59 |
| ROE | -1.32% | Debt/Eq | 65.64 | Current Ratio | 1.57 |
| Short Interest | 84.15K | Short Float | 0.08% | Short Ratio | 2.32 |
| Avg Vol | 362.66K | Div Yield | — | Next Earnings | 2021-08-16 |
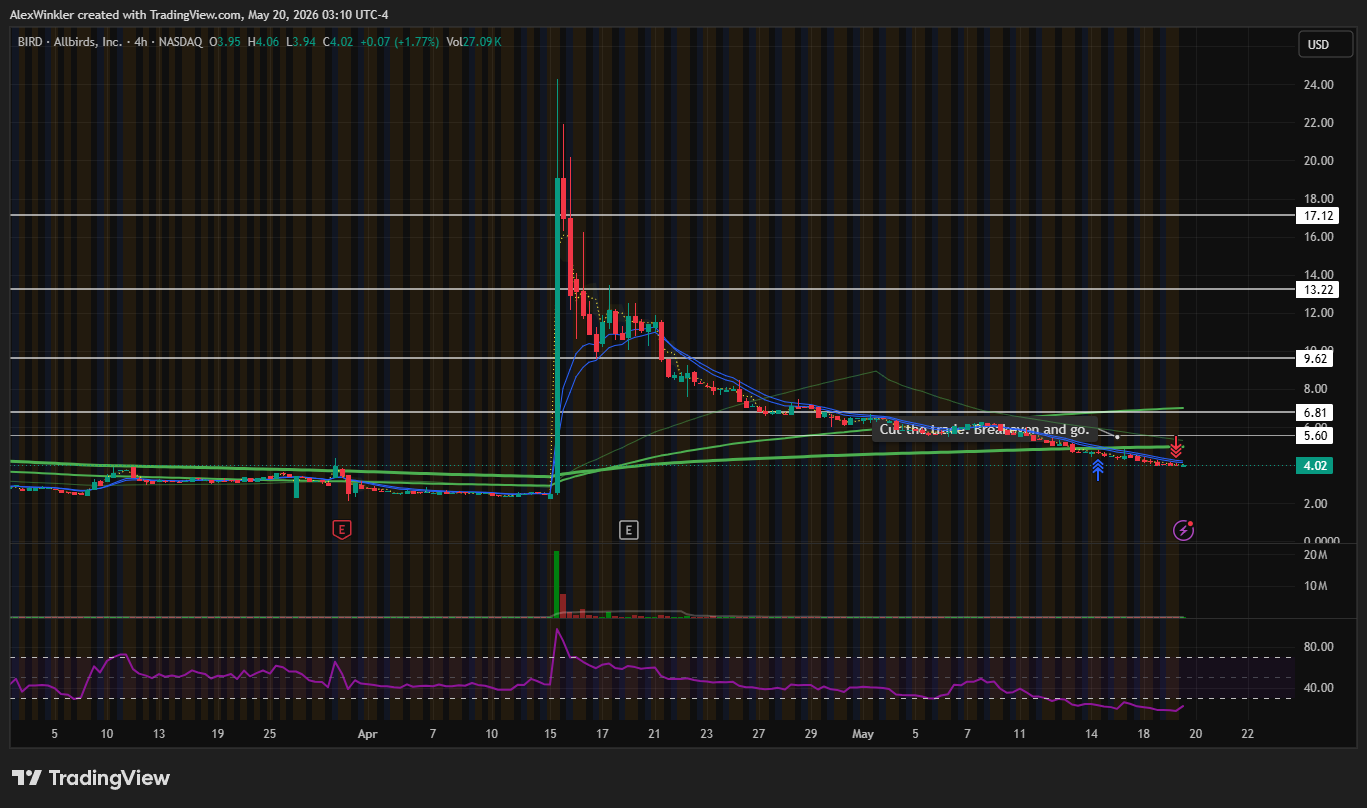
Auto-generated Chart
Notes
I like I like, was expecting though a bigger more and not this ABC flag pattern which if I was would have made this much better of a trade, would have been nice to make 2 trades out of this.
Transactions
3 entries| Date | Side | Amount | Price | Commission | Exchange / SEC | Current amt | Current value |
|---|---|---|---|---|---|---|---|
| Jun 01, 2020 11:42:30 | Exit | ||||||
| Jun 01, 2020 11:39:54 | Exit | ||||||
| Jun 01, 2020 11:35:50 | Entry |