
August 3, 2026 (2 Trades) (+$11.25)
Overall Grade: B-
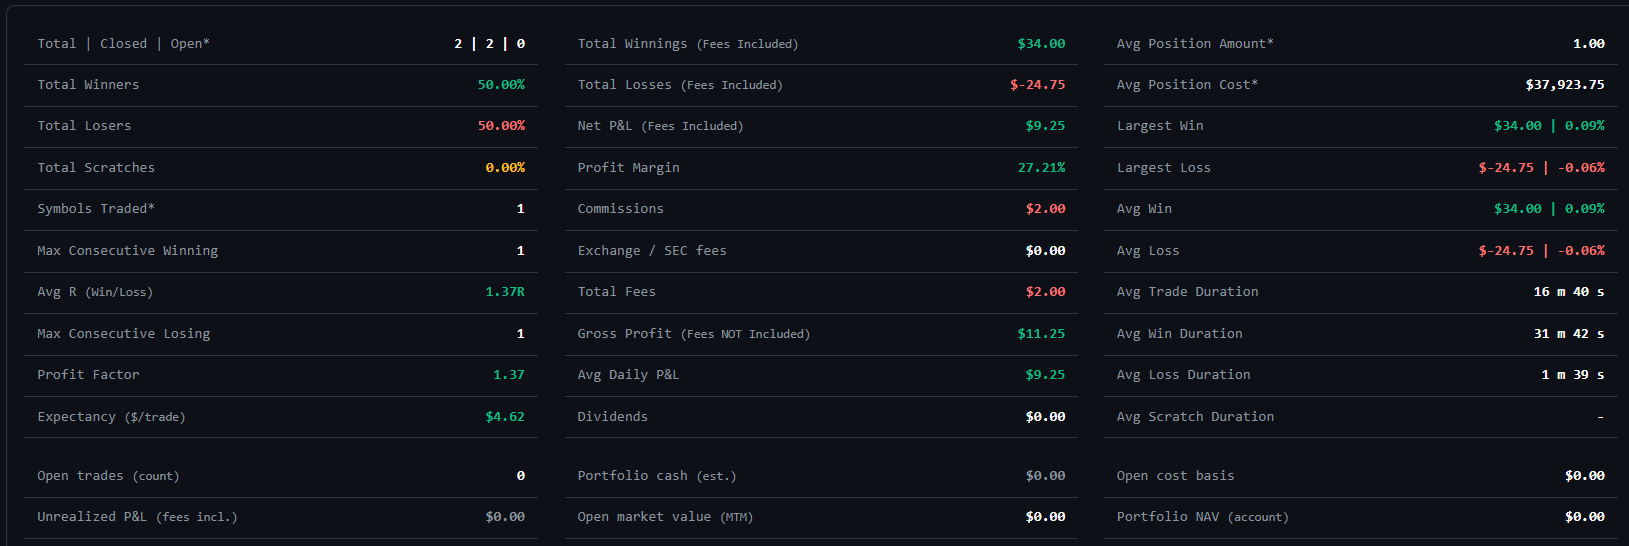

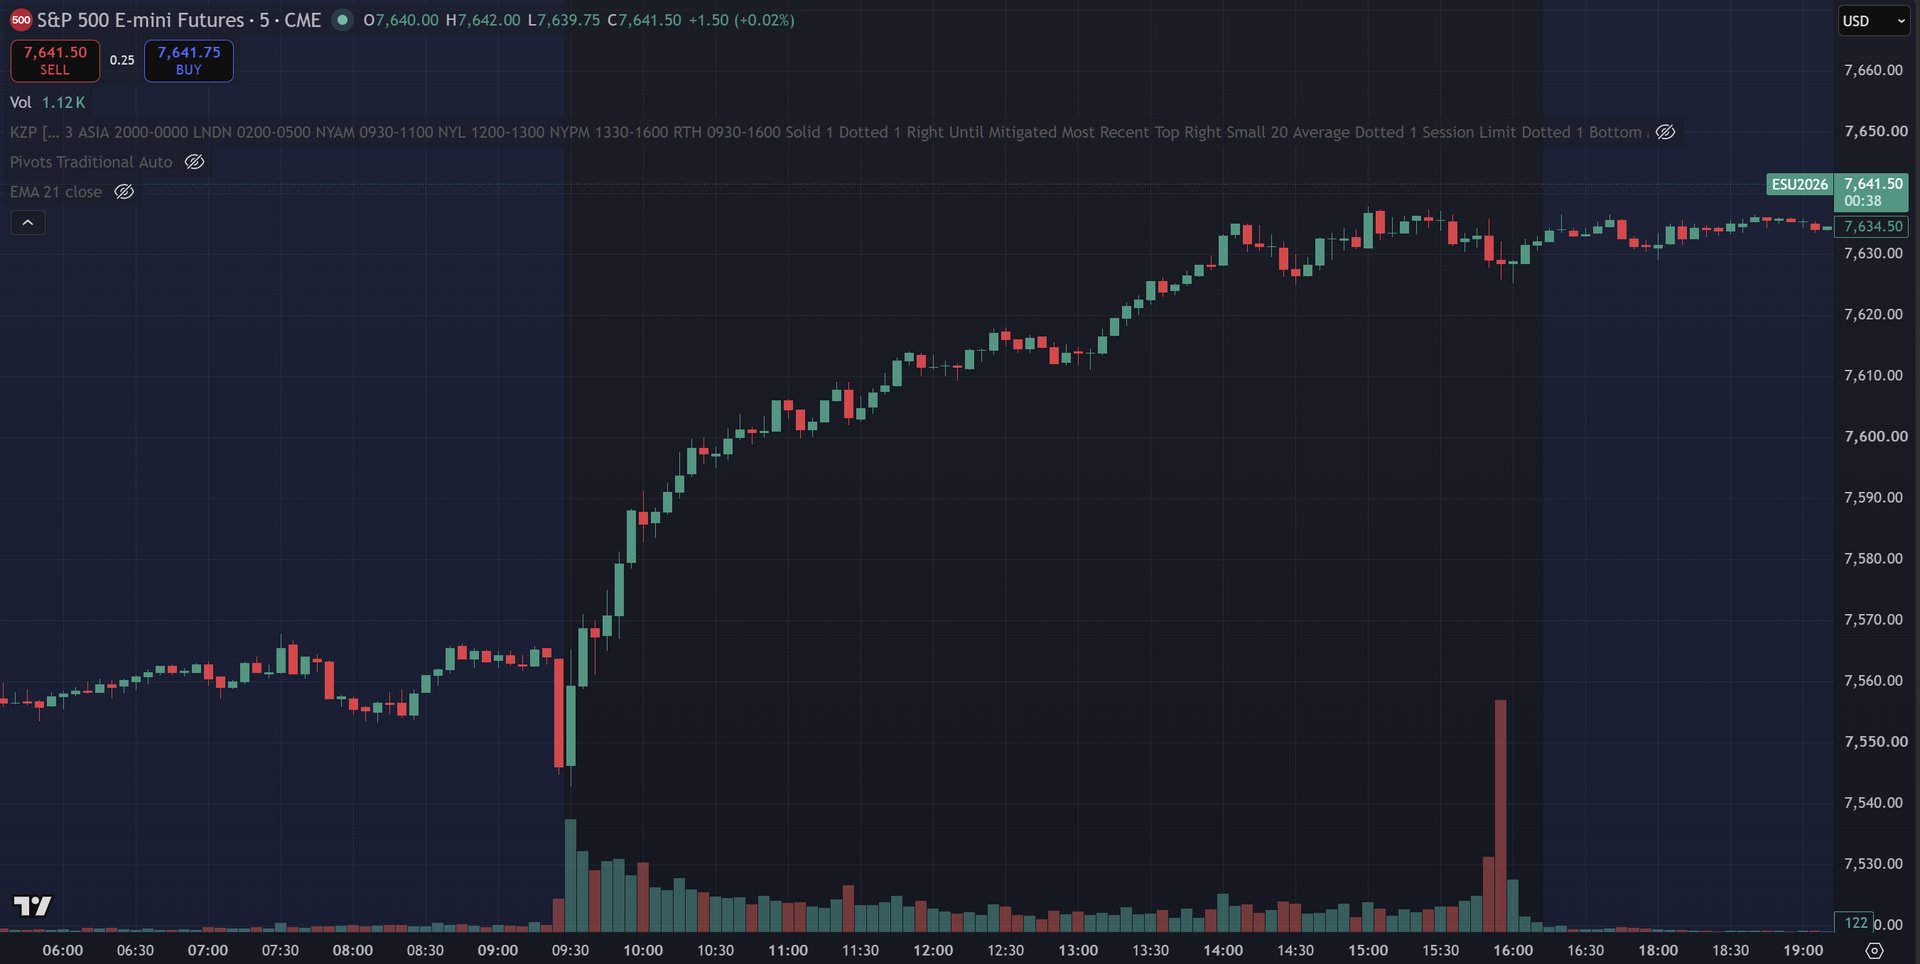
Day Summary: I was a little jumpy to start the day today and, because I was simply thinking about making money, I completely ignored what the chart was showing me and was forcing shorts (Only one on my live account but multple on my evals). Thankfully, I had some luck on the evals and got them back to breakeven on the day, even though I was shorting, before I finally came to my senses and realized the chart was clearly showing that bulls were in control. The DOM really helped me to confirm that the bulls would jump back in and target resting liquidity above on every quick dip. Long was the play today and I did a really good job staying in my second trade on the live thanks to the 2000 tick chart compared to the 1 min chart (a change I just made on Friday, July 31, 2026).
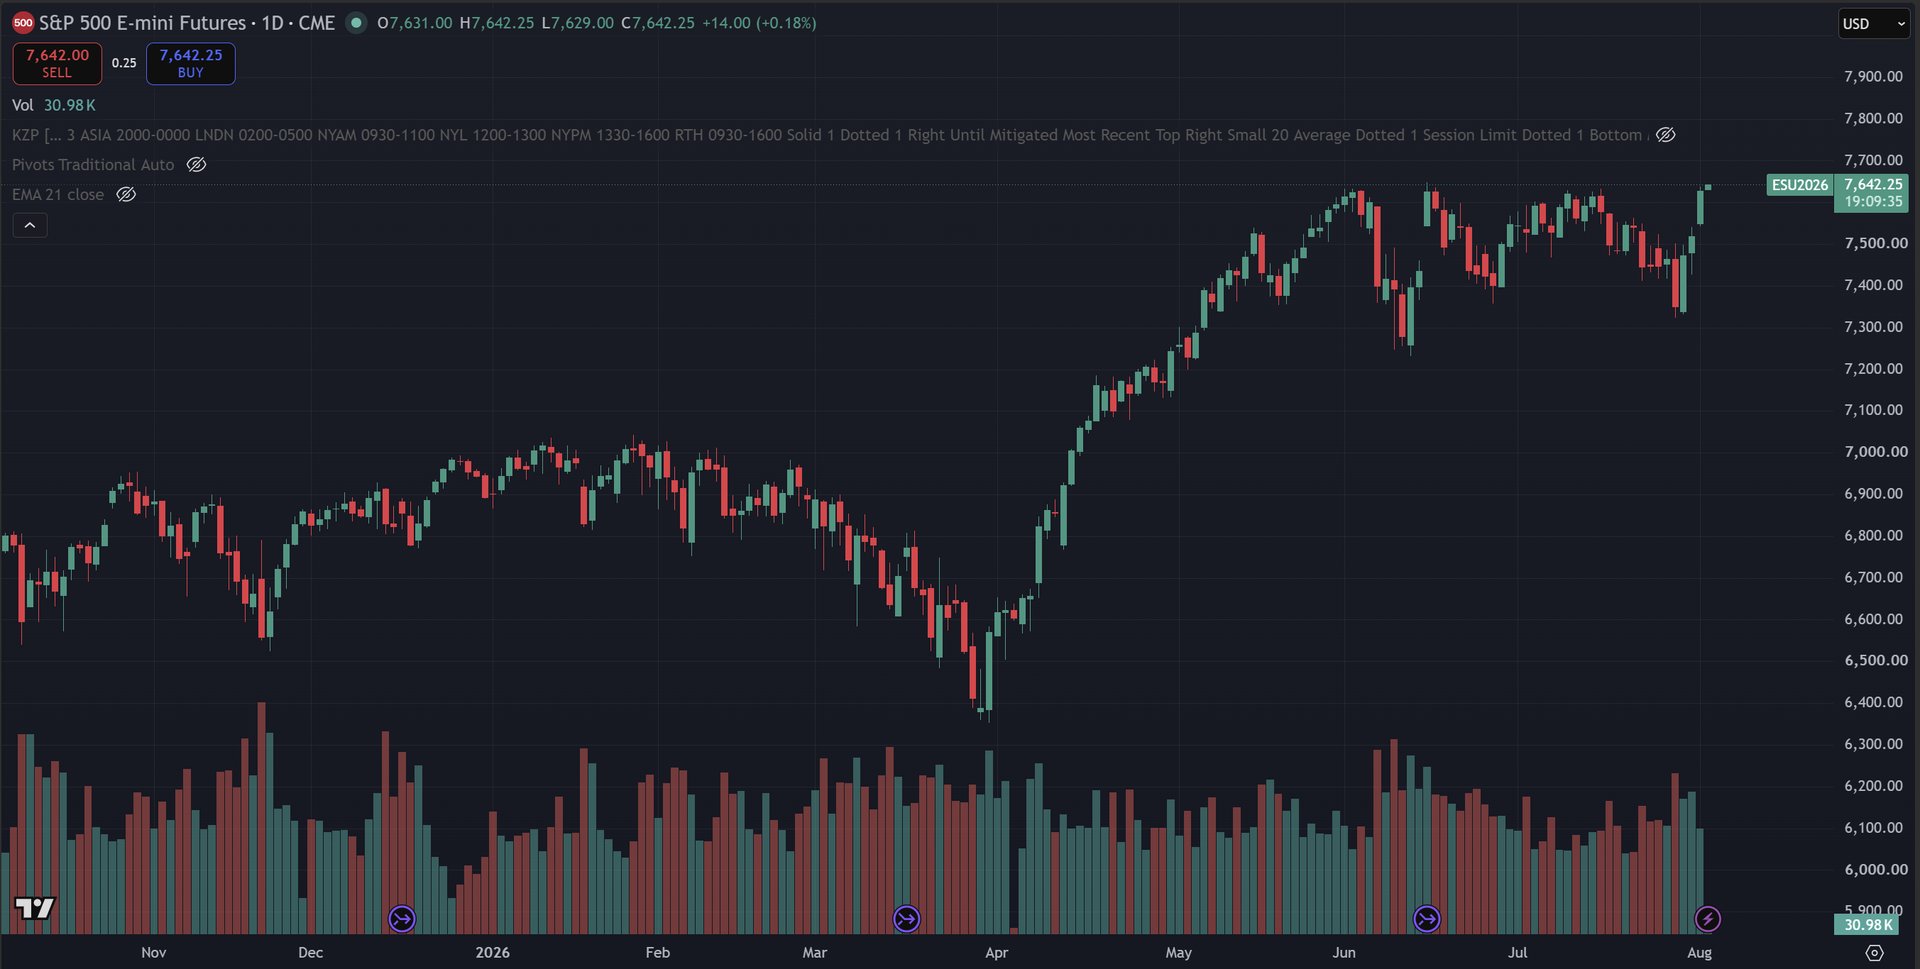
DAILY - ES
5 MIN - ES
TRADES
Trade 1 - Short 1 MES @ No Set Up + Fighting The Trend + Thinking About The Money
Grade: D-
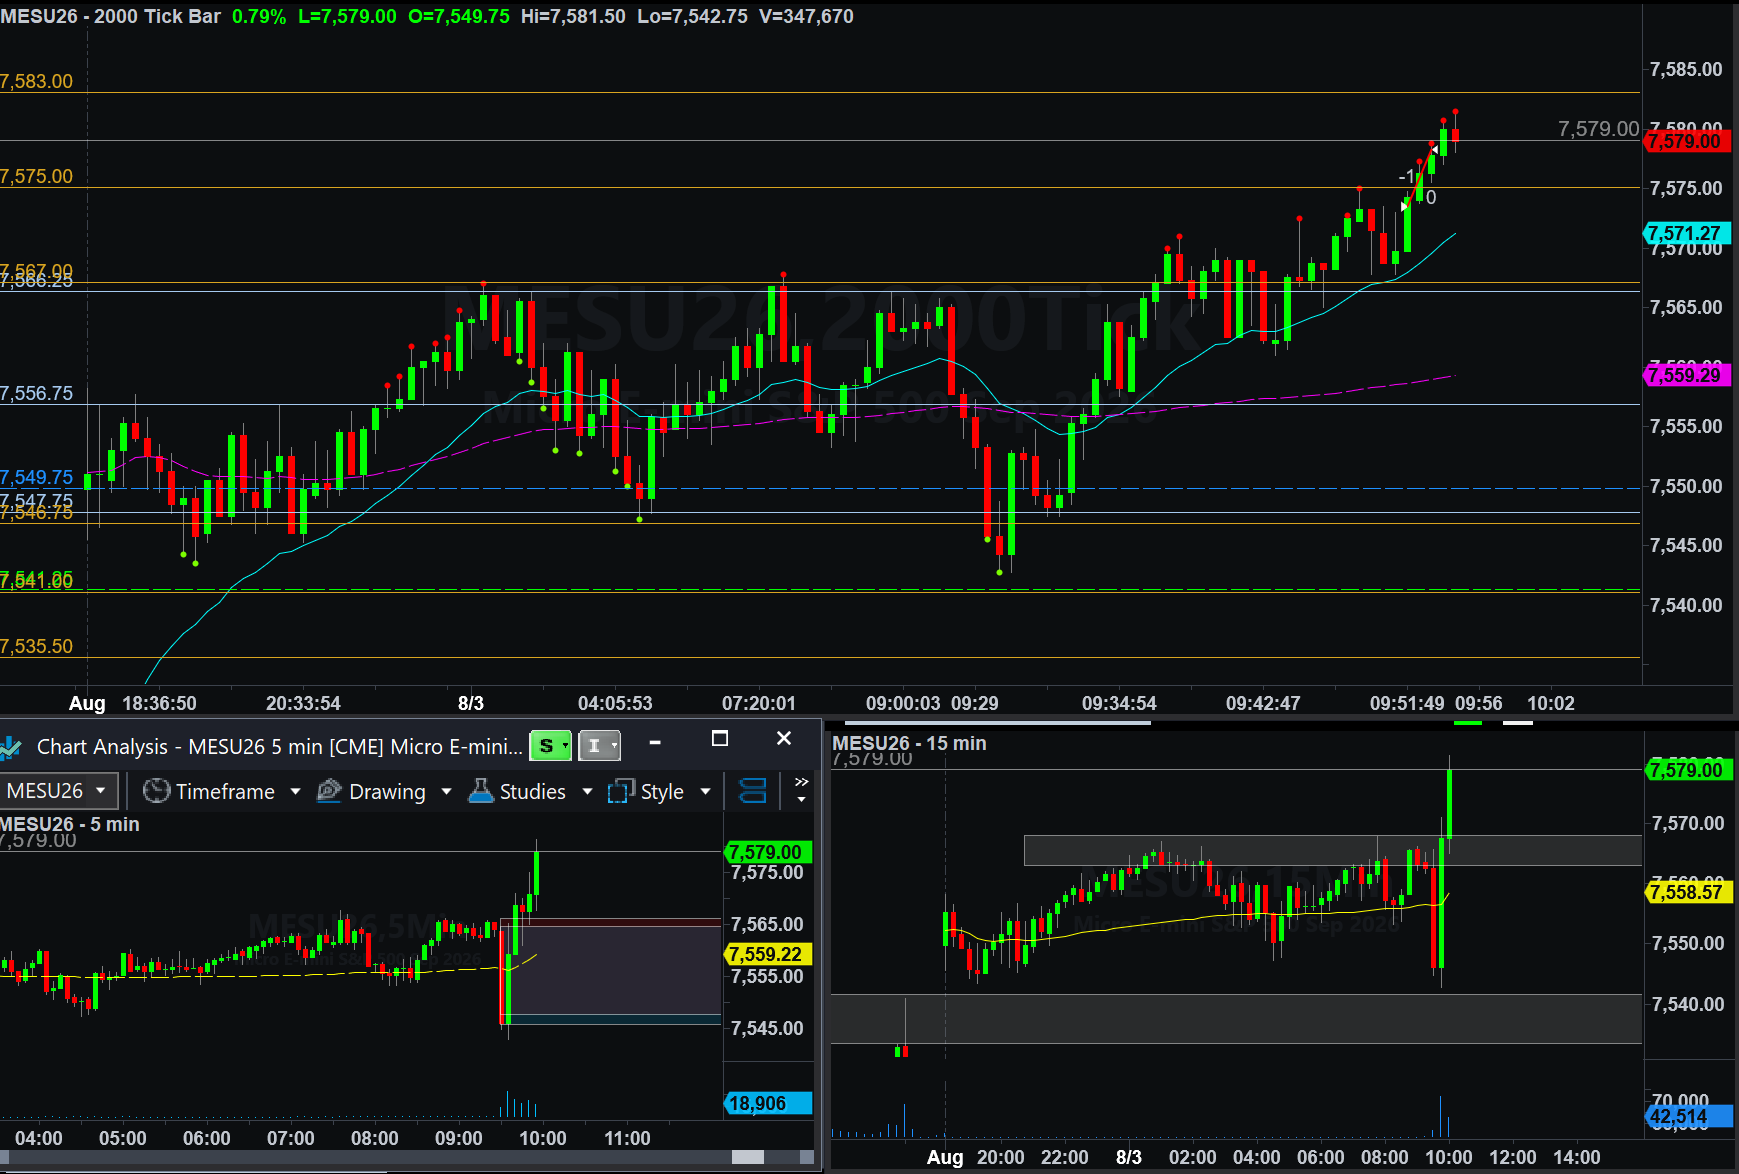
- terrible trade - terrible spot to enter short
- no set up, just thinking about the money
- completely ignoring price action - higher lows
- the only reason this trade is not an F trade is because I realized I was being a dumbass and cut the loss at only 4 points
Trade 2 - Long 1 MES @ 21 EMA Trap + Aggressive Entry + Price Action + Order Flow
Grade: B+
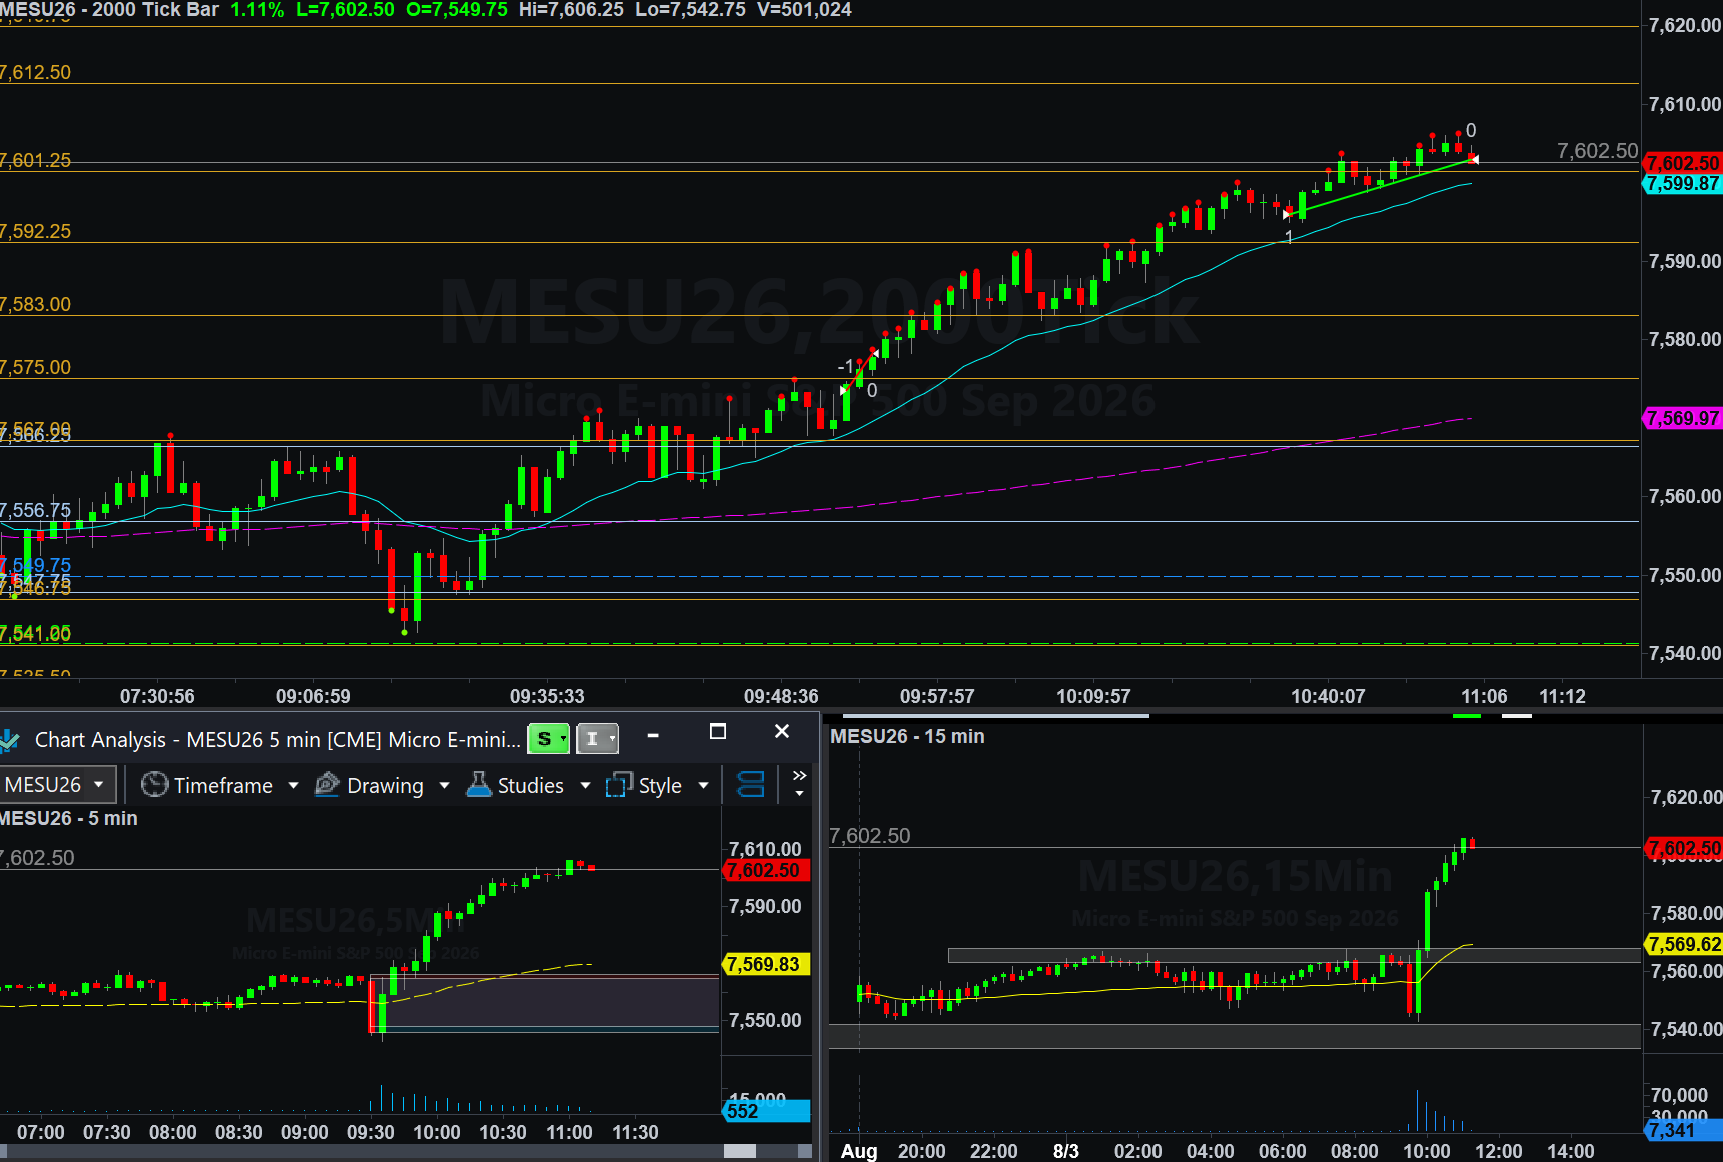
- flipped the bias - good - just look at what the chart was doing lol
- 21 ema trap - aggressive entry but order flow and price action made me feel more comfortable getting in where I did
- trading with the trend - good
- honestly I prob would have stopped out on this trade if I was using the 1 min chart because the PA looked a lot sketchier, but volume doesn't lie (the entry candle to the next green candle was probably like a 5-7min period so it was a lot harder to hold than it looks on this chart)
- It also helped me to stay in this trade, and although I did trail my stop and get taken out before target (7609.50) it was still very good considering I was trading from the red